
System Usability Scale (SUS) Practical Guide for 2025
Written for UXtweak by John Bellio
Thursday, December 19, 2024
System Usability Scale (SUS) Practical Guide for 2025
Written by
Lead UX Designer

In this article, we’ll provide a practical guide on the system usability scale. We will go over its purpose, how to calculate the SUS scores, and interpret the results. With a brief overview of its origins, we will also analyze what is considered a good SUS score and what future awaits this popular usability testing metric.Link to the article here: https://blog.uxtweak.com/system-usability-scale/

What is a System Usability Scale (SUS)?
The system usability scale (SUS) is a standardized questionnaire (survey) used to measure the perceived usability of a system (product). It provides a score from 0 to 100, where higher scores indicate better usability.
The SUS questionnaire consists of 10 questions (statements) which respondents answer using a 5-point Likert scale. Their answers indicate their level of agreement or disagreement with the statements ( 1 = strongly disagree, to 5 = strongly agree).
If you take a close look at the SUS questions above, you will notice that the statements alternate – odd-numbered ones are positive, and even-numbered ones are negative.
This is to prevent respondents from choosing the same answer for all questions and to counteract the acquiescence bias – a natural tendency of people to rather agree with statements than disagree.
Origins of SUS
The System Usability Scale (SUS) was developed by John Brooke in 1984 to provide a tool for measuring the usability of various systems. Brooke created SUS while working at Digital Equipment Corporation to address the need for a simple yet reliable method to evaluate system usability across different industries.
Over the years, SUS has gained global adoption due to its ease of use, reliability, and validity – in fact, the original paper has over 20,000 citations. Nowadays, it’s one of the most well-known and most commonly used methodologies in usability assessment and its integration with UX practices has proven to be effective for many companies.
The System Usability Scale questions
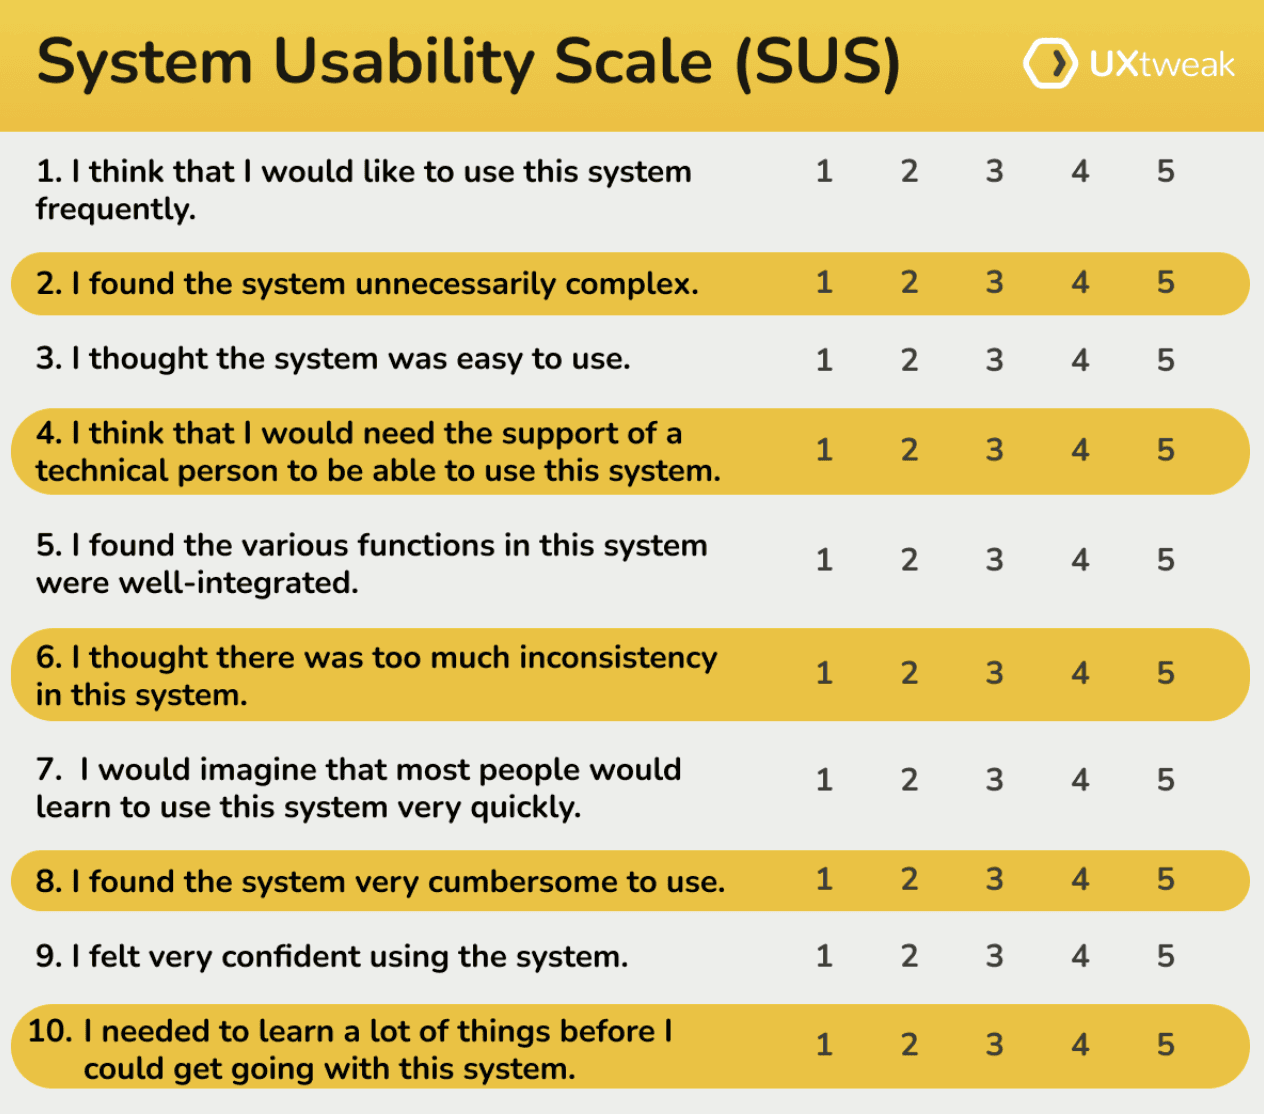
The ten statements in the system usability scale questionnaire are:
I think that I would like to use this system frequently.
I found the system unnecessarily complex.
I thought the system was easy to use.
I think that I would need the support of a technical person to be able to use this system.
I found the various functions in this system were well-integrated.
I thought there was too much inconsistency in this system.
I would imagine that most people would learn to use this system very quickly.
I found the system very cumbersome to use.
I felt very confident using the system.
I needed to learn a lot of things before I could get going with this system.
Questions 1, 3, 5, 7, and 9 are positively-oriented questions, using wording associated with positive statements, such as “like,” “easy,” “quickly,” and “confident.”
Questions 2, 4, 6, 8, and 10 are negatively-oriented questions, where the question and wording have negative associations like “complex,” “inconsistency,” and “cumbersome.”
This mixed approach helps capture a comprehensive perspective of a user’s experience with the application.
As participants go through the questionnaire, they rank their responses on a scale of one to five (Likert scale), where 1 = “Strongly disagree”, and 5 = “Strongly agree”. For example:
Question: I think that I would like to use this system frequently.
Possible answers:

How to calculate the SUS score?
To score the system usability scale, follow these steps after gathering responses from participants:
1. Subtract one from the user response for odd items (questions)
Take each positively-oriented question score (i.e., for questions 1, 3, 5, 7, and 9) and subtract one from the participant’s answer. Answers will range from zero to four.
2. Subtract the user responses from 5 for even-numbered items
Take each negatively-oriented question score (i.e., for question 2, 4, 6, 8, and 10) and subtract the participant’s answer from five. Answers will range from zero to four.
3. Sum up the adjusted scores
Total scores will range from 0 to 40.
4. Multiply the total score by 2.5.
This is the system usability score (SUS). Scores will range from zero to 100.
This is how you get the score for one respondent.
5. Calculate the average score of all respondents
To get the overall score, take the total score of each participant and calculate the average.
(Overall SUS score = Total score of Repondent 1 + Total score of Respondent 2… + Total score of Respondent N/N)
You will use your overall SUS score as a benchmark to compare it to past and future SUS scores or with industry averages.
Scoring the SUS brings a bit of complexity, and is one of the impediments for using the system. However, because the system usability scale has demonstrated its value experimentally for decades, there is a wide range of industry data available to benchmark results and understand them within the context of the competition. This makes the learning curve to operating the system worthwhile.
System usability scale scoring example
To better understand how to calculate an SUS score, we prepared an example.
Let’s imagine that a participant completed the SUS questionnaire following a usability test. Their responses are below:
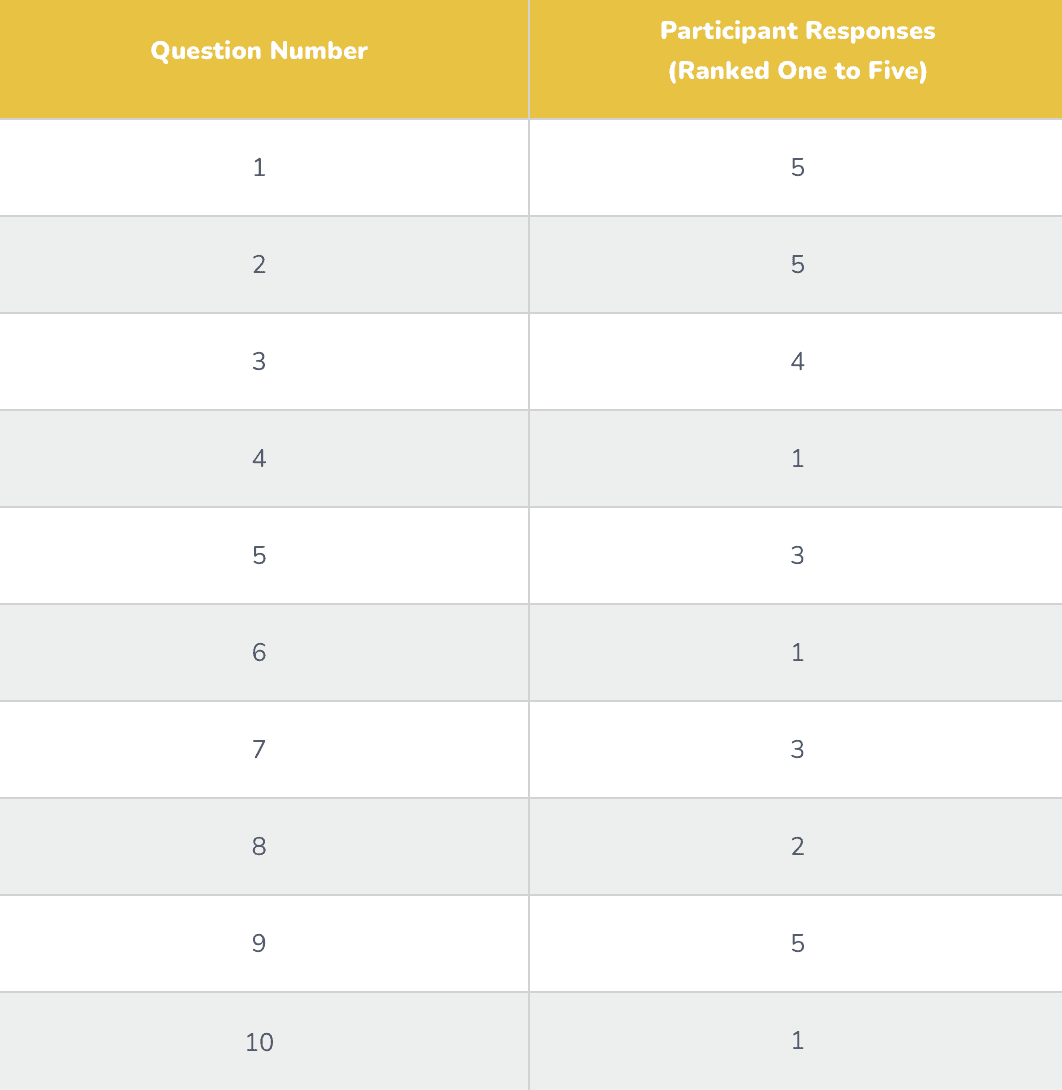
Step 1: Take each positively-oriented question score (questions 1, 3, 5, 7, and 9) and subtract one from the participant’s answer. Answers will range from zero to four.
Example:
Participant score: 5 (Strongly agree)
Subtract one from the participant’s answer to get four (5 – 1 = 4)

Step 2: Take each negatively-oriented question score (questions 2, 4, 6, 8, and 10) and subtract the participant’s answer from five. Answers will range from zero to four.
Example:
Participant score: 5 (Strongly agree)
Subtract the participant’s answer from five to get zero (5 – 5 = 0)

Step 3: Sum up the adjusted scores for all items to obtain a total score. Total scores will range from zero to 40.
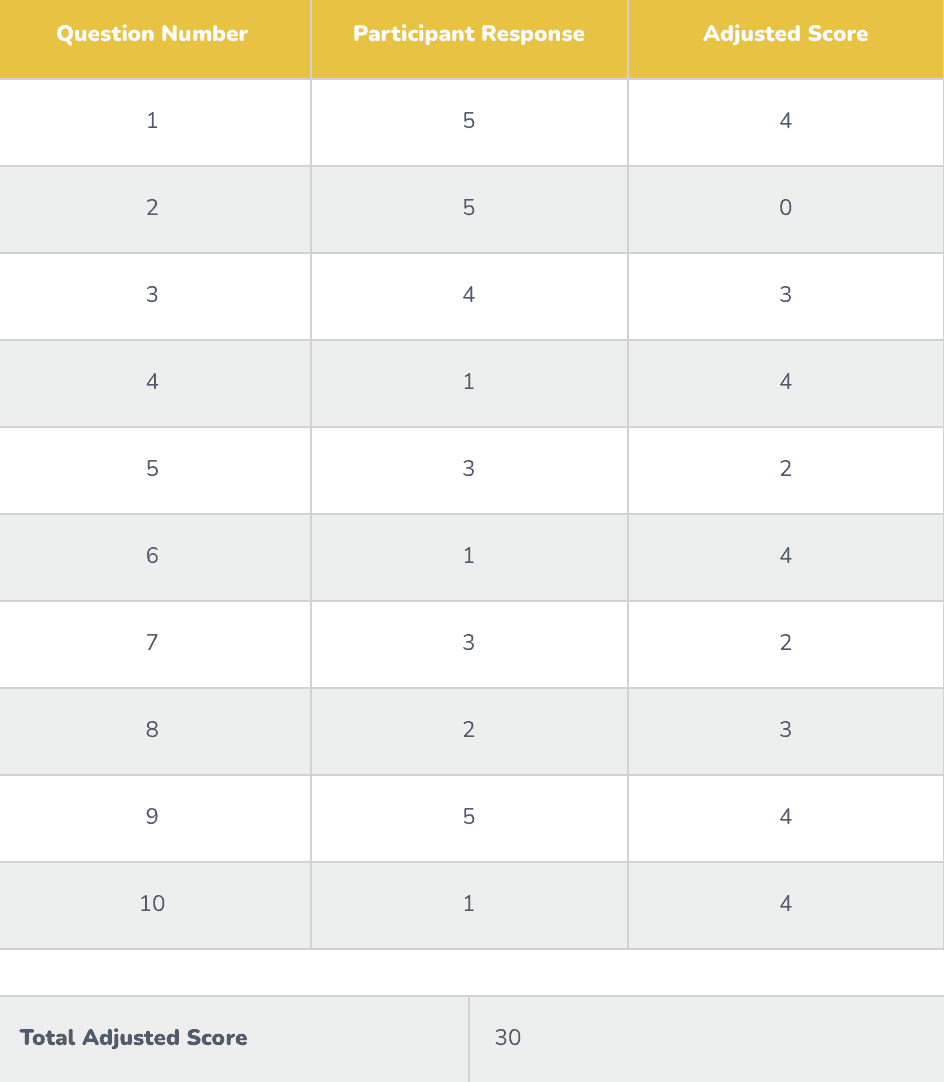
Step 4: Multiply the total score by 2.5. This is the system usability score (SUS). Scores will range from zero to 100.
Example:
30 x 2.5 = 75 (SUS)
Benefits of using a System Usability Scale
The benefits of leveraging the system usability scale are multifactorial. Inherently designed to provide measurement for perceived ease-of-use for a website or application, they can provide deep insight into the following areas:
Learnability – how easy a system is to learn.
Several questions are included in SUS to better understand how users perceive learnability with the application by exploring how easily users can grasp the system.
Efficiency – how efficient or fast it is to use the system.
SUS can provide helpful insight into whether or not users find the application easy or cumbersome to use.
Satisfaction – how satisfied users are with the system.
Though indirect, SUS can help explain whether or not users would regularly enjoy using the application – or if they find it complex.
SUS has a strong record of consistently being a reliable and valid tool for measuring usability. It’s shown to effectively provide valuable insights to smaller sample-size audiences, making them easier to leverage than larger commercial techniques. SUS has also proven to consistently provide valid measurements around perceived usability, meaning any researcher or team can trust the results.
It is important to note, however, that Likert scale questions also open the door to potential biases: acquiescence bias and social-desirability bias. Acquiescence bias refers to people’s tendency to agree with others. Social-desirability bias refers to somones’ desire to report positive views that will be received well by others.
Nevertheless, the system usability scale has withstood the test of time and has established itself as a reliable research method that can be utilized with confidence.
Things to remember when creating SUS surveys
Do not change the order of the SUS questions
Maintaining the structure of the SUS questions when performing research is important since changing the order of the questions or scale will affect the scoring when calculating the final results.Do not alter the wording of the questions – altering the wording of the questions can impede comparisons if SUS scores are being collected from other designs and will make it impossible to compare your scores to industry benchmarks.
Do not change the wording or order of the Likert scales – as mentioned earlier, changing the wording would make it impossible to compare results with results from other studies. Additionally, altering the order could confuse participants familiar with the traditional Likert scale format, where “strongly disagree” is on the left and agreement increases towards the right.
What is a good SUS score?
Jeff Sauro, PhD, has found that the average SUS score is 68. Therefore, a SUS score of 70 doesn’t mean the same thing as scoring 70% on an exam – because the 70 point SUS score is actually above average.
Additionally, a SUS score of 80.8 is actually in the top 10% of all SUS scores, which would be similar to scoring an “A” on a test (even though the score is 80 out of 100).
The below table normalizes several ranges of SUS scores by ‘grade’ in order to help better rank usability.

When it comes to interpreting SUS scores, it’s important to remember that there are also many other acceptable ways to provide meaningful comparisons – such as with percentiles, acceptability, and NPS.
Conclusion
In summary, SUS scores are a helpful measurement to learn whether or not users find your website or app easy-to-use and efficient. Additionally, it can provide a global measure of satisfaction and help provide deeper insight into particular dimensions of usability.
When it comes to today’s competitive landscape, enhancing efficiency, intuitiveness, and usability has become an order qualifier. Begin your journey to better and more efficient systems by partnering with UXtweak and leveraging the power of SUS. See the full article on UXtweak here: https://blog.uxtweak.com/system-usability-scale/

More articles
Wednesday, January 1, 2025
Written by
John Bellio
How to Conduct Heuristic Evaluation w/ Nielsen’s 10 Usability Heuristics
Written for UXtweak by John Bellio
With the advent of new technologies, evaluating and enhancing the usability of experiences has become increasingly important. In this article, we delve into the 10 usability heuristics, explore their application in performing heuristic evaluations, and provide insights on improving the overall usability of your product.

Friday, April 21, 2023
Written by
John Bellio
Deceptive Persuasive Practice in UX Design
Written for UXtweak by John Bellio
The field of persuasive design involves the use of design strategies to influence user behavior. It includes both positive persuasive practices, as well as negative or deceptive persuasive practices. Leveraging human psychology through common heuristics must be implemented ethically in order to maintain the integrity of businesses, products, and the field of UX design as a whole.
System Usability Scale (SUS) Practical Guide for 2025
Written for UXtweak by John Bellio
Thursday, December 19, 2024
System Usability Scale (SUS) Practical Guide for 2025
Written by
Lead UX Designer
In this article, we’ll provide a practical guide on the system usability scale. We will go over its purpose, how to calculate the SUS scores, and interpret the results. With a brief overview of its origins, we will also analyze what is considered a good SUS score and what future awaits this popular usability testing metric.Link to the article here: https://blog.uxtweak.com/system-usability-scale/
What is a System Usability Scale (SUS)?
The system usability scale (SUS) is a standardized questionnaire (survey) used to measure the perceived usability of a system (product). It provides a score from 0 to 100, where higher scores indicate better usability.
The SUS questionnaire consists of 10 questions (statements) which respondents answer using a 5-point Likert scale. Their answers indicate their level of agreement or disagreement with the statements ( 1 = strongly disagree, to 5 = strongly agree).
If you take a close look at the SUS questions above, you will notice that the statements alternate – odd-numbered ones are positive, and even-numbered ones are negative.
This is to prevent respondents from choosing the same answer for all questions and to counteract the acquiescence bias – a natural tendency of people to rather agree with statements than disagree.
Origins of SUS
The System Usability Scale (SUS) was developed by John Brooke in 1984 to provide a tool for measuring the usability of various systems. Brooke created SUS while working at Digital Equipment Corporation to address the need for a simple yet reliable method to evaluate system usability across different industries.
Over the years, SUS has gained global adoption due to its ease of use, reliability, and validity – in fact, the original paper has over 20,000 citations. Nowadays, it’s one of the most well-known and most commonly used methodologies in usability assessment and its integration with UX practices has proven to be effective for many companies.
The System Usability Scale questions
The ten statements in the system usability scale questionnaire are:
I think that I would like to use this system frequently.
I found the system unnecessarily complex.
I thought the system was easy to use.
I think that I would need the support of a technical person to be able to use this system.
I found the various functions in this system were well-integrated.
I thought there was too much inconsistency in this system.
I would imagine that most people would learn to use this system very quickly.
I found the system very cumbersome to use.
I felt very confident using the system.
I needed to learn a lot of things before I could get going with this system.
Questions 1, 3, 5, 7, and 9 are positively-oriented questions, using wording associated with positive statements, such as “like,” “easy,” “quickly,” and “confident.”
Questions 2, 4, 6, 8, and 10 are negatively-oriented questions, where the question and wording have negative associations like “complex,” “inconsistency,” and “cumbersome.”
This mixed approach helps capture a comprehensive perspective of a user’s experience with the application.
As participants go through the questionnaire, they rank their responses on a scale of one to five (Likert scale), where 1 = “Strongly disagree”, and 5 = “Strongly agree”. For example:
Question: I think that I would like to use this system frequently.
Possible answers:
How to calculate the SUS score?
To score the system usability scale, follow these steps after gathering responses from participants:
1. Subtract one from the user response for odd items (questions)
Take each positively-oriented question score (i.e., for questions 1, 3, 5, 7, and 9) and subtract one from the participant’s answer. Answers will range from zero to four.
2. Subtract the user responses from 5 for even-numbered items
Take each negatively-oriented question score (i.e., for question 2, 4, 6, 8, and 10) and subtract the participant’s answer from five. Answers will range from zero to four.
3. Sum up the adjusted scores
Total scores will range from 0 to 40.
4. Multiply the total score by 2.5.
This is the system usability score (SUS). Scores will range from zero to 100.
This is how you get the score for one respondent.
5. Calculate the average score of all respondents
To get the overall score, take the total score of each participant and calculate the average.
(Overall SUS score = Total score of Repondent 1 + Total score of Respondent 2… + Total score of Respondent N/N)
You will use your overall SUS score as a benchmark to compare it to past and future SUS scores or with industry averages.
Scoring the SUS brings a bit of complexity, and is one of the impediments for using the system. However, because the system usability scale has demonstrated its value experimentally for decades, there is a wide range of industry data available to benchmark results and understand them within the context of the competition. This makes the learning curve to operating the system worthwhile.
System usability scale scoring example
To better understand how to calculate an SUS score, we prepared an example.
Let’s imagine that a participant completed the SUS questionnaire following a usability test. Their responses are below:
Step 1: Take each positively-oriented question score (questions 1, 3, 5, 7, and 9) and subtract one from the participant’s answer. Answers will range from zero to four.
Example:
Participant score: 5 (Strongly agree)
Subtract one from the participant’s answer to get four (5 – 1 = 4)
Step 2: Take each negatively-oriented question score (questions 2, 4, 6, 8, and 10) and subtract the participant’s answer from five. Answers will range from zero to four.
Example:
Participant score: 5 (Strongly agree)
Subtract the participant’s answer from five to get zero (5 – 5 = 0)
Step 3: Sum up the adjusted scores for all items to obtain a total score. Total scores will range from zero to 40.
Step 4: Multiply the total score by 2.5. This is the system usability score (SUS). Scores will range from zero to 100.
Example:
30 x 2.5 = 75 (SUS)
Benefits of using a System Usability Scale
The benefits of leveraging the system usability scale are multifactorial. Inherently designed to provide measurement for perceived ease-of-use for a website or application, they can provide deep insight into the following areas:
Learnability – how easy a system is to learn.
Several questions are included in SUS to better understand how users perceive learnability with the application by exploring how easily users can grasp the system.
Efficiency – how efficient or fast it is to use the system.
SUS can provide helpful insight into whether or not users find the application easy or cumbersome to use.
Satisfaction – how satisfied users are with the system.
Though indirect, SUS can help explain whether or not users would regularly enjoy using the application – or if they find it complex.
SUS has a strong record of consistently being a reliable and valid tool for measuring usability. It’s shown to effectively provide valuable insights to smaller sample-size audiences, making them easier to leverage than larger commercial techniques. SUS has also proven to consistently provide valid measurements around perceived usability, meaning any researcher or team can trust the results.
It is important to note, however, that Likert scale questions also open the door to potential biases: acquiescence bias and social-desirability bias. Acquiescence bias refers to people’s tendency to agree with others. Social-desirability bias refers to somones’ desire to report positive views that will be received well by others.
Nevertheless, the system usability scale has withstood the test of time and has established itself as a reliable research method that can be utilized with confidence.
Things to remember when creating SUS surveys
Do not change the order of the SUS questions
Maintaining the structure of the SUS questions when performing research is important since changing the order of the questions or scale will affect the scoring when calculating the final results.Do not alter the wording of the questions – altering the wording of the questions can impede comparisons if SUS scores are being collected from other designs and will make it impossible to compare your scores to industry benchmarks.
Do not change the wording or order of the Likert scales – as mentioned earlier, changing the wording would make it impossible to compare results with results from other studies. Additionally, altering the order could confuse participants familiar with the traditional Likert scale format, where “strongly disagree” is on the left and agreement increases towards the right.
What is a good SUS score?
Jeff Sauro, PhD, has found that the average SUS score is 68. Therefore, a SUS score of 70 doesn’t mean the same thing as scoring 70% on an exam – because the 70 point SUS score is actually above average.
Additionally, a SUS score of 80.8 is actually in the top 10% of all SUS scores, which would be similar to scoring an “A” on a test (even though the score is 80 out of 100).
The below table normalizes several ranges of SUS scores by ‘grade’ in order to help better rank usability.
When it comes to interpreting SUS scores, it’s important to remember that there are also many other acceptable ways to provide meaningful comparisons – such as with percentiles, acceptability, and NPS.
Conclusion
In summary, SUS scores are a helpful measurement to learn whether or not users find your website or app easy-to-use and efficient. Additionally, it can provide a global measure of satisfaction and help provide deeper insight into particular dimensions of usability.
When it comes to today’s competitive landscape, enhancing efficiency, intuitiveness, and usability has become an order qualifier. Begin your journey to better and more efficient systems by partnering with UXtweak and leveraging the power of SUS. See the full article on UXtweak here: https://blog.uxtweak.com/system-usability-scale/
More articles
How to Conduct Heuristic Evaluation w/ Nielsen’s 10 Usability Heuristics
Written for UXtweak by John Bellio
Deceptive Persuasive Practice in UX Design
Written for UXtweak by John Bellio
System Usability Scale (SUS) Practical Guide for 2025
Written for UXtweak by John Bellio
Thursday, December 19, 2024
System Usability Scale (SUS) Practical Guide for 2025
Written by
Lead UX Designer
In this article, we’ll provide a practical guide on the system usability scale. We will go over its purpose, how to calculate the SUS scores, and interpret the results. With a brief overview of its origins, we will also analyze what is considered a good SUS score and what future awaits this popular usability testing metric.Link to the article here: https://blog.uxtweak.com/system-usability-scale/
What is a System Usability Scale (SUS)?
The system usability scale (SUS) is a standardized questionnaire (survey) used to measure the perceived usability of a system (product). It provides a score from 0 to 100, where higher scores indicate better usability.
The SUS questionnaire consists of 10 questions (statements) which respondents answer using a 5-point Likert scale. Their answers indicate their level of agreement or disagreement with the statements ( 1 = strongly disagree, to 5 = strongly agree).
If you take a close look at the SUS questions above, you will notice that the statements alternate – odd-numbered ones are positive, and even-numbered ones are negative.
This is to prevent respondents from choosing the same answer for all questions and to counteract the acquiescence bias – a natural tendency of people to rather agree with statements than disagree.
Origins of SUS
The System Usability Scale (SUS) was developed by John Brooke in 1984 to provide a tool for measuring the usability of various systems. Brooke created SUS while working at Digital Equipment Corporation to address the need for a simple yet reliable method to evaluate system usability across different industries.
Over the years, SUS has gained global adoption due to its ease of use, reliability, and validity – in fact, the original paper has over 20,000 citations. Nowadays, it’s one of the most well-known and most commonly used methodologies in usability assessment and its integration with UX practices has proven to be effective for many companies.
The System Usability Scale questions
The ten statements in the system usability scale questionnaire are:
I think that I would like to use this system frequently.
I found the system unnecessarily complex.
I thought the system was easy to use.
I think that I would need the support of a technical person to be able to use this system.
I found the various functions in this system were well-integrated.
I thought there was too much inconsistency in this system.
I would imagine that most people would learn to use this system very quickly.
I found the system very cumbersome to use.
I felt very confident using the system.
I needed to learn a lot of things before I could get going with this system.
Questions 1, 3, 5, 7, and 9 are positively-oriented questions, using wording associated with positive statements, such as “like,” “easy,” “quickly,” and “confident.”
Questions 2, 4, 6, 8, and 10 are negatively-oriented questions, where the question and wording have negative associations like “complex,” “inconsistency,” and “cumbersome.”
This mixed approach helps capture a comprehensive perspective of a user’s experience with the application.
As participants go through the questionnaire, they rank their responses on a scale of one to five (Likert scale), where 1 = “Strongly disagree”, and 5 = “Strongly agree”. For example:
Question: I think that I would like to use this system frequently.
Possible answers:
How to calculate the SUS score?
To score the system usability scale, follow these steps after gathering responses from participants:
1. Subtract one from the user response for odd items (questions)
Take each positively-oriented question score (i.e., for questions 1, 3, 5, 7, and 9) and subtract one from the participant’s answer. Answers will range from zero to four.
2. Subtract the user responses from 5 for even-numbered items
Take each negatively-oriented question score (i.e., for question 2, 4, 6, 8, and 10) and subtract the participant’s answer from five. Answers will range from zero to four.
3. Sum up the adjusted scores
Total scores will range from 0 to 40.
4. Multiply the total score by 2.5.
This is the system usability score (SUS). Scores will range from zero to 100.
This is how you get the score for one respondent.
5. Calculate the average score of all respondents
To get the overall score, take the total score of each participant and calculate the average.
(Overall SUS score = Total score of Repondent 1 + Total score of Respondent 2… + Total score of Respondent N/N)
You will use your overall SUS score as a benchmark to compare it to past and future SUS scores or with industry averages.
Scoring the SUS brings a bit of complexity, and is one of the impediments for using the system. However, because the system usability scale has demonstrated its value experimentally for decades, there is a wide range of industry data available to benchmark results and understand them within the context of the competition. This makes the learning curve to operating the system worthwhile.
System usability scale scoring example
To better understand how to calculate an SUS score, we prepared an example.
Let’s imagine that a participant completed the SUS questionnaire following a usability test. Their responses are below:
Step 1: Take each positively-oriented question score (questions 1, 3, 5, 7, and 9) and subtract one from the participant’s answer. Answers will range from zero to four.
Example:
Participant score: 5 (Strongly agree)
Subtract one from the participant’s answer to get four (5 – 1 = 4)
Step 2: Take each negatively-oriented question score (questions 2, 4, 6, 8, and 10) and subtract the participant’s answer from five. Answers will range from zero to four.
Example:
Participant score: 5 (Strongly agree)
Subtract the participant’s answer from five to get zero (5 – 5 = 0)
Step 3: Sum up the adjusted scores for all items to obtain a total score. Total scores will range from zero to 40.
Step 4: Multiply the total score by 2.5. This is the system usability score (SUS). Scores will range from zero to 100.
Example:
30 x 2.5 = 75 (SUS)
Benefits of using a System Usability Scale
The benefits of leveraging the system usability scale are multifactorial. Inherently designed to provide measurement for perceived ease-of-use for a website or application, they can provide deep insight into the following areas:
Learnability – how easy a system is to learn.
Several questions are included in SUS to better understand how users perceive learnability with the application by exploring how easily users can grasp the system.
Efficiency – how efficient or fast it is to use the system.
SUS can provide helpful insight into whether or not users find the application easy or cumbersome to use.
Satisfaction – how satisfied users are with the system.
Though indirect, SUS can help explain whether or not users would regularly enjoy using the application – or if they find it complex.
SUS has a strong record of consistently being a reliable and valid tool for measuring usability. It’s shown to effectively provide valuable insights to smaller sample-size audiences, making them easier to leverage than larger commercial techniques. SUS has also proven to consistently provide valid measurements around perceived usability, meaning any researcher or team can trust the results.
It is important to note, however, that Likert scale questions also open the door to potential biases: acquiescence bias and social-desirability bias. Acquiescence bias refers to people’s tendency to agree with others. Social-desirability bias refers to somones’ desire to report positive views that will be received well by others.
Nevertheless, the system usability scale has withstood the test of time and has established itself as a reliable research method that can be utilized with confidence.
Things to remember when creating SUS surveys
Do not change the order of the SUS questions
Maintaining the structure of the SUS questions when performing research is important since changing the order of the questions or scale will affect the scoring when calculating the final results.Do not alter the wording of the questions – altering the wording of the questions can impede comparisons if SUS scores are being collected from other designs and will make it impossible to compare your scores to industry benchmarks.
Do not change the wording or order of the Likert scales – as mentioned earlier, changing the wording would make it impossible to compare results with results from other studies. Additionally, altering the order could confuse participants familiar with the traditional Likert scale format, where “strongly disagree” is on the left and agreement increases towards the right.
What is a good SUS score?
Jeff Sauro, PhD, has found that the average SUS score is 68. Therefore, a SUS score of 70 doesn’t mean the same thing as scoring 70% on an exam – because the 70 point SUS score is actually above average.
Additionally, a SUS score of 80.8 is actually in the top 10% of all SUS scores, which would be similar to scoring an “A” on a test (even though the score is 80 out of 100).
The below table normalizes several ranges of SUS scores by ‘grade’ in order to help better rank usability.
When it comes to interpreting SUS scores, it’s important to remember that there are also many other acceptable ways to provide meaningful comparisons – such as with percentiles, acceptability, and NPS.
Conclusion
In summary, SUS scores are a helpful measurement to learn whether or not users find your website or app easy-to-use and efficient. Additionally, it can provide a global measure of satisfaction and help provide deeper insight into particular dimensions of usability.
When it comes to today’s competitive landscape, enhancing efficiency, intuitiveness, and usability has become an order qualifier. Begin your journey to better and more efficient systems by partnering with UXtweak and leveraging the power of SUS. See the full article on UXtweak here: https://blog.uxtweak.com/system-usability-scale/
More articles
How to Conduct Heuristic Evaluation w/ Nielsen’s 10 Usability Heuristics
Written for UXtweak by John Bellio
Deceptive Persuasive Practice in UX Design
Written for UXtweak by John Bellio
Design that leads.
Success that lasts.
Begin your project today with a personalized one-on-one consultation.
Trusted by industry leaders


Design that leads.
Success that lasts.
Begin your project today with a personalized one-on-one consultation.
Trusted by industry leaders
Design that leads.
Success that lasts.
Begin your project today with a personalized one-on-one consultation.
Trusted by industry leaders